The Management and Monitoring gadgets include gadgets designed for providing the overall vision of the system. These gadgets monitor the system and provide the current system performance statistics which are especially useful for the system administrators and developers.
eXo Platform provides 3 types of the Monitoring gadget:
Memory
Caches level
Application Statistics
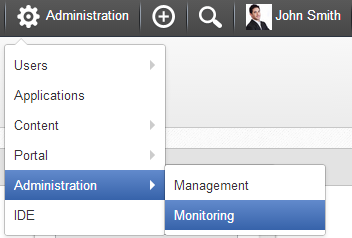
You can use these gadgets from the Dashboard Workspace. However, you can quickly use them via the Monitoring page by clicking → → on the top navigation bar.
The Memory gadget provides the statistics of heap and non-heap memory via charts which show the part of used memory and remaining memory during runtime.
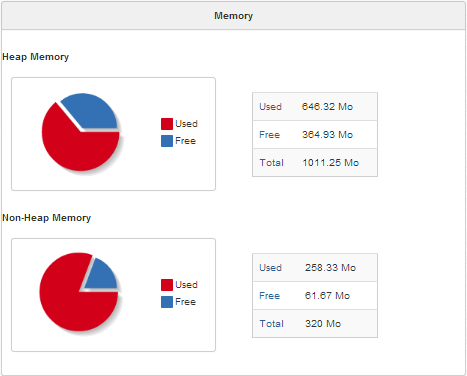
In the table next to the chart, you can see:
Used: The total used memory.
Free: The total free memory.
Total: The total memory.
The Caches level gadget displays the eXo cache levels and settings. Based on these statistics, the administrators can configure the cache settings properly to get better performance:
If the cache is full but the hit ratio is low (or missed ratio is high), it means the cache is full of unnecessary data. It should be cleared and/or its size is increased, or its lifetime is decreased.
If the cache is full and the hit ratio is high, this is good. It means most of data are retrieved from the cache, but not from the database, so the system gets better performances.
If the cache is empty, it should be configured differently, for example, increasing its lifetime.
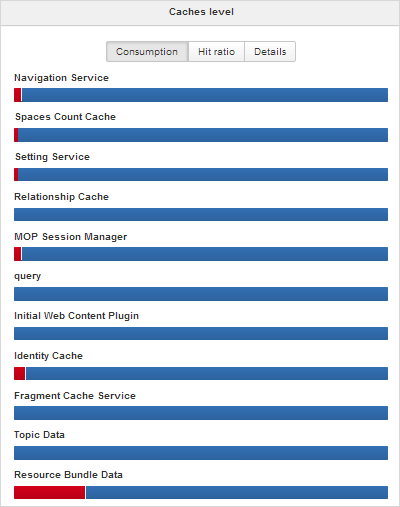
The Consumption tab shows the overall cache consumption in the system.
The Hit ratio tab shows the ratio between requested data fetched from cache and data fetched from database.
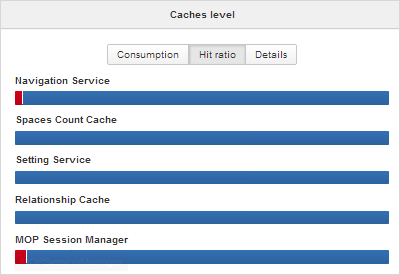
The Details tab shows the cache level and the current cache settings.
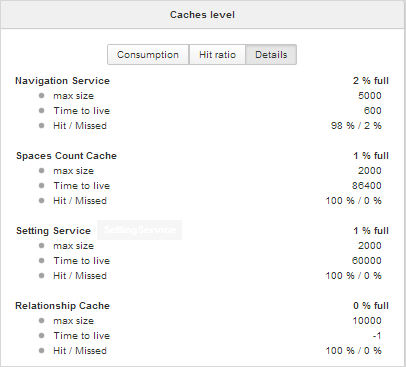
In which:
Max size: The maximum size of the cache.
Time to live: The lifetime (in seconds) of cache entries before being cleared.
Hit/Missed: The percentage of data fetched from cache versus the percentage of data fetched from database.
The Application Statistics gadget lists all information related to the execution time of all applications in the portal, therefore administrators and developers will know how fast applications are and which ones should be optimized.
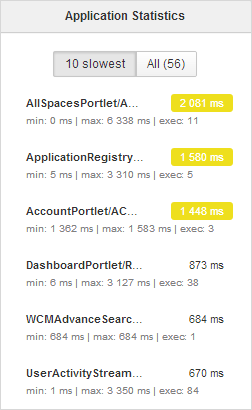
The gadget consists of two tabs:
10 Slowest: Lists 10 slowest applications in the portal.
All: Shows the total number of applications and a list of the applications in the portal.
Each application provides you with the following information:
The execution phase next to the application name (if any). For example: AllSpacesPortlet/ACTION_PHASE
The full path of the application when you hover your cursor over its name.
The average execution time (in ms) highlighted next to the application name.
The time will be highlighted with the yellow color if it is more than 1000 ms and less than 5000 ms.
The time will be highlighted with the red color if it is more than 5000 ms.
exec: The number of executions of the application.
min: The minimum execution time of the application.
max: The maximum execution time of the application.
The Service Management gadget provides an interface to interact with manageable services via REST management API.
You can use these gadgets from the Dashboard Workspace. However, you can quickly use them via the Service Management page by clicking → → on the top navigation bar.
The Service Management page is displayed.
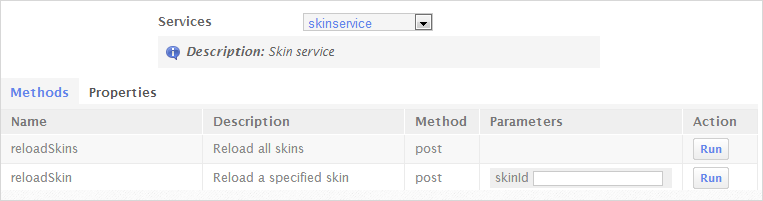
Select the service from the Services drop-down list. For each selected service, its respective methods and properties are shown.
To invoke a method of the selected service, click corresponding to it. After invoking it successfully, you will see the result returned if any.